The Missing Middle: A tale of two portfolios
Every retirement portfolio has to answer a practical question: how do you turn savings into reliable income, while preserving enough capital to stay invested through market cycles?
For decades, the answer has usually been framed around three building blocks: cash and bonds for defence, equities for growth and dividends, and diversification between the two. That framework remains sound. But for many investors approaching or in retirement, it can leave a gap.
The gap sits between defensive assets and growth assets – a space for investments designed to generate income above cash and bonds, without relying wholly on equity markets to deliver the outcome. We describe that space as the missing middle. And for retirees, filling it well can change not just the final number, but the journey along the way.
Let’s look at two ways to build the same retirement income portfolio.
Two portfolios, one decision
The allocations below are a hypothetical model portfolio for illustrative purposes only. They are not a forecast, and not a recommendation to adopt any particular allocation. Any investment decision should reflect your own objectives, financial situation and needs.
In this theoretical example, both portfolios begin in the same place: a retiree invests $1 million and draws all income generated over a 20-year retirement-income horizon. The purpose of the model is not to predict future performance, but to isolate how different asset allocations may alter income, volatility and drawdown outcomes over time. While individual investors will have different investment horizons and may draw capital as well as income, a 20-year period provides a useful framework for examining long-term retirement outcomes.
Portfolio One takes the traditional route, often used by self-directed investors –equities for growth and dividend income, with bonds and cash for defence.
Portfolio Two trims cash and equity exposures, and fills the space with a deliberately robust, income-producing allocation to alternative assets. For this example, the middle allocation is represented by La Trobe Financial’s 12 Month Investment Account – an income-producing alternative asset exposure.
That single change – the missing middle – is the only difference between them.
Missing Middle
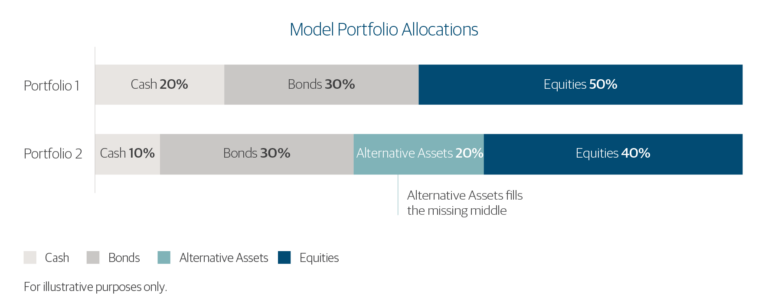
The allocation shown is a hypothetical model portfolio for illustrative purposes only. It is not a forecast or recommendation.
We have modelled returns as follows, using the past 20 years for each input:
- Cash: 3.0% p.a., approximate RBA Cash Rate.
- Bonds: 4.0% p.a., Bloomberg AusBond Composite 0+Yr Index.
- Equities: 8.0% p.a., comprising 4.0% dividend income and 4.0% capital growth –S&P/ASX 200 Index.
- Alternative Assets: 6.14% p.a., represented here by the La Trobe Financial 12 Month Investment Account.
Equities and bonds move in line with historical market returns and volatility. Cash is held stable.
What the model shows
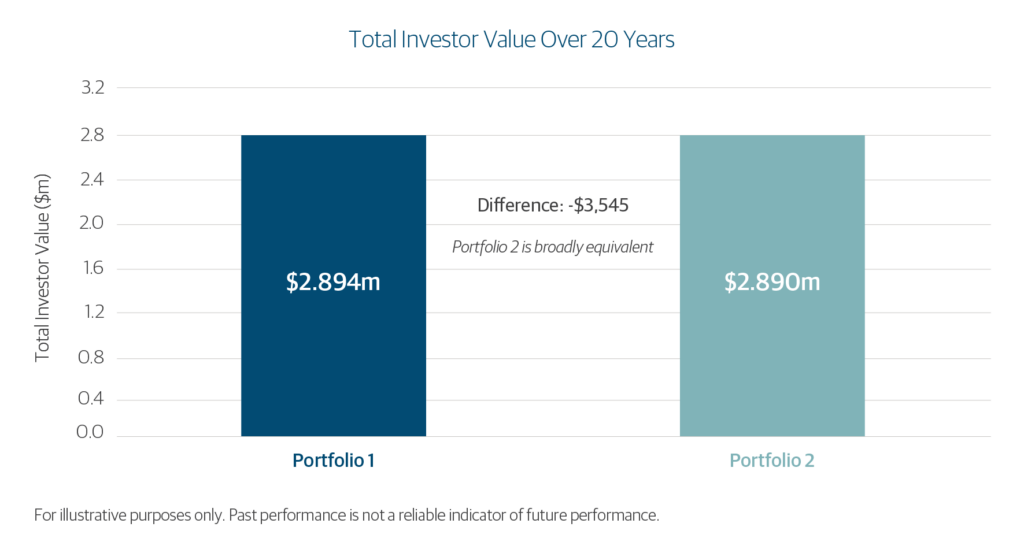
The headline result is surprisingly modest: the two portfolios finish in broadly the same place. Total investor value is similar, and the annualised total return is broadly equivalent.
That is the point. The missing middle is not about manufacturing a dramatically higher end value. It is about changing how the return is delivered.
In the model, Portfolio 2 produces more income along the way, with lower annual volatility, a milder worst year and a shallower maximum drawdown. For a retiree drawing income from a portfolio, that distinction can matter.
Why the path matters
Volatility is not merely a statistical measure. It can affect portfolio values, income outcomes and investor behaviour during periods of market stress.
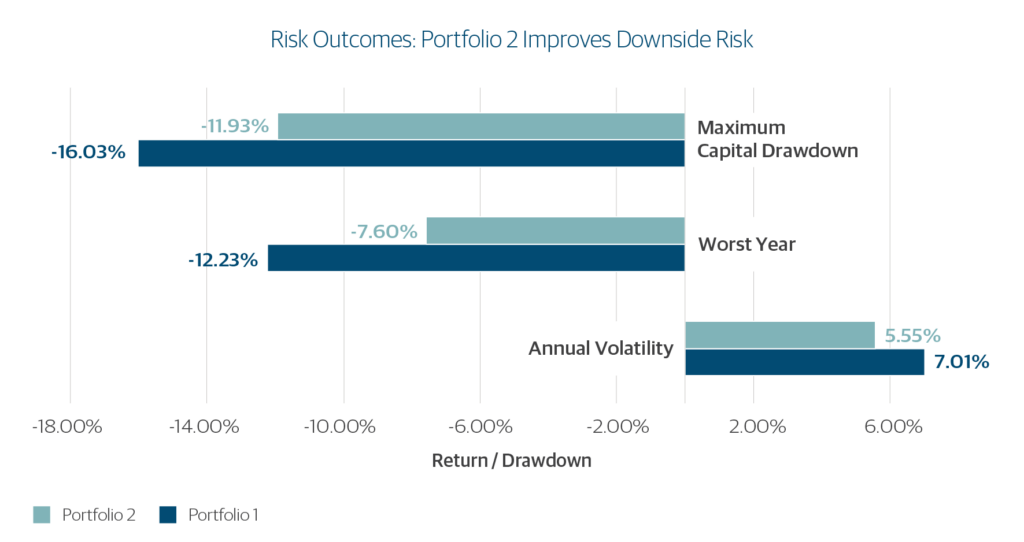
Missing Middle Improves Downside Risk
In this example, adding alternative assets lowers annual volatility from 7.01% to 5.55%, improves the worst year from -12.23% to -7.60%, and reduces the maximum capital drawdown from -16.03% to -11.93%.
These differences are not merely mathematical: they affect how investors experience the portfolio. A portfolio that swings less can mean fewer moments of stress, fewer reactive decisions, and a better chance of staying the course when markets get difficult. Just as importantly, it reduces the need to sell assets after they have fallen in order to fund income – the kind of forced drawdown that can quietly erode income for years to come.
Income delivered
Income is not abstract. It is what you spend, reinvest or rely on to fund the life you have planned.
Over 20 years, Portfolio 2 delivers approximately $1.15 million in income, against approximately $1.04 million for Portfolio 1 – around $114,000 more, from the same $1 million starting point.
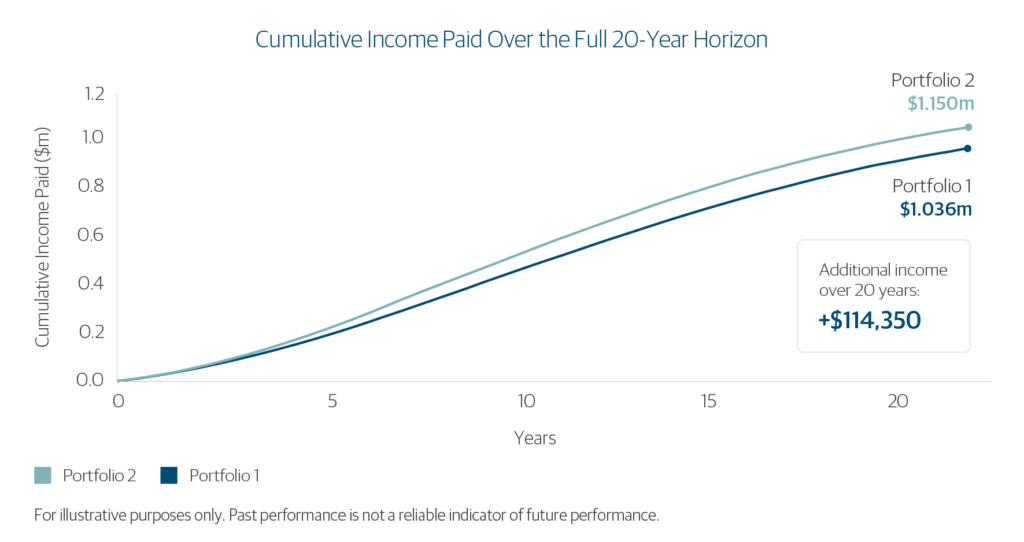
That additional income does not come from taking more listed-equity risk. It comes from accepting a different mix of risks – including credit and liquidity risk – in exchange for a higher level of contracted income and a smoother listed-market return profile.
The trade-off, stated plainly
Every portfolio decision involves trade-offs. Portfolio 2 has some downsides – its strongest years are a little lower.
But that is precisely the point. The goal is not to capture the highest possible return in the strongest markets. Put simply, Portfolio 2 converts more of the investor outcome into paid income along the way, while leaving a lower final capital value. The total outcome is broadly equivalent, but the experience is different: more income, less reliance on market growth, lower volatility and reduced drawdowns over time.
Filling the gap
For a long time, the choice has been framed too narrowly: safety in cash, growth in equities, bonds somewhere in between.
That structure still matters. But it can leave income-seeking retirees over-reliant on equity markets to do the heavy lifting.
Alternative assets such as the 12 Month Investment Account can help occupy the middle ground – while deserving the same careful scrutiny as any investment. It is not risk-free. Credit, such as the mortgage-backed investments housed in the 12 Month Investment Account, can be affected by borrower defaults, movements in interest rates, changes in property values and broader economic conditions. In some circumstances, income payments may be delayed, capital may be reduced, and investors may have less flexibility to access their money than they would with listed assets. Used well, though, it provides a source of contractual income that sits between defensive and growth assets – helping a portfolio do more than simply alternate between caution and risk.
This is the missing middle: an allocation designed to lift income, steady the ride, and complement – not replace – the roles of cash, bonds and equities.
A better-balanced outcome
The conclusion is not that one portfolio is superior. It is that the composition of return matters.
A portfolio that delivers more of its outcome through income, and less through reliance on market appreciation, may be better aligned to the objectives of many retirees.
This is the role of the missing middle: not to replace cash, bonds or equities, but to complement them by introducing an additional source of contractual income within a diversified portfolio.
Model notes:
Weighted income yield Portfolio 1:
(20% × 3.0%) + (50% × 4.0%) + (30% × 4.0%) = 3.80%
Weighted income yield Portfolio 2:
(10% × 3.0%) + (40% × 4.0%) + (30% × 4.0%) + (20% × 6.14%) = 4.33%
What the model shows
| Metric | Portfolio 1 | Portfolio 2 | Difference |
| Total investor value | $2.894m | $2.890m | -$3,545 |
| Cumulative income paid | $1.036m | $1.150m | +$114,350 |
| Final capital value | $1.858m | $1.740m | -$117,896 |
| Total gain vs $1m | $1.894m | $1.890m | -$3,545 |
| Annualised total return | 5.46% | 5.45% | Broadly equivalent |
| Annual total return volatility | 7.01% | 5.55% | -1.47 percentage points |
| Worst annual investor return | -12.23% | -7.60% | +4.62 percentage points |
| Best annual investor return | +19.75% | +17.18% | -2.57 percentage points |
| Maximum capital drawdown | – 16.03% | -11.93% | +4.10 percentage points |
For illustrative purposes only. Past performance is not a reliable indicator of future performance.
La Trobe Financial Asset Management Limited ACN 007 332 363 Australian Financial Services Licence No. 222213 Australian Credit Licence No. 222213 is the responsible entity of the La Trobe Australian Credit Fund ARSN 088 178 321. It is important that you consider the Product Disclosure Statement (PDS) when deciding whether to invest or continue to invest in the fund. The PDS and Target Market Determinations are available on our website.
Past Performance is not a reliable indicator of future performance.
Any Financial product advice is general only and has been prepared without considering your objectives, financial situation or needs. You should, before investing or continuing to invest in the La Trobe Australian Credit Fund, consider the appropriateness of the advice having regard to your objectives, financial situation or needs and consider the Product Disclosure Statement for the fund.
When considering whether to invest or continue investing in the La Trobe Australian Credit Fund, you should be aware that (1) an investment in the La Trobe Australian Credit Fund is not a term deposit, and your investment is not covered by the Australian Government’s deposit guarantee scheme. Investing in the La Trobe Australian Credit Fund has a higher level of risk compared to investing in a term deposit issued by a bank and (2) there are other risks associated with an investment in the La Trobe Australian Credit Fund. The key risks of investing in the La Trobe Australian Credit Fund are explained in section 9 of the PDS, available on our website.
©2026 La Trobe Financial Services Pty Limited. All rights reserved. No portion of this may be reproduced, copied, or in any way reused without written permission from La Trobe Financial.